Our geophysicists work closely with geologists to narrow down the potential sweet spots for detailed exploration and drilling. For doing so, we provide the following disciplines for our clients:
-
Gravity
-
Magnetic
-
Magneto-telluric (MT)
-
Electromagnetic (EM)
-
Seismic
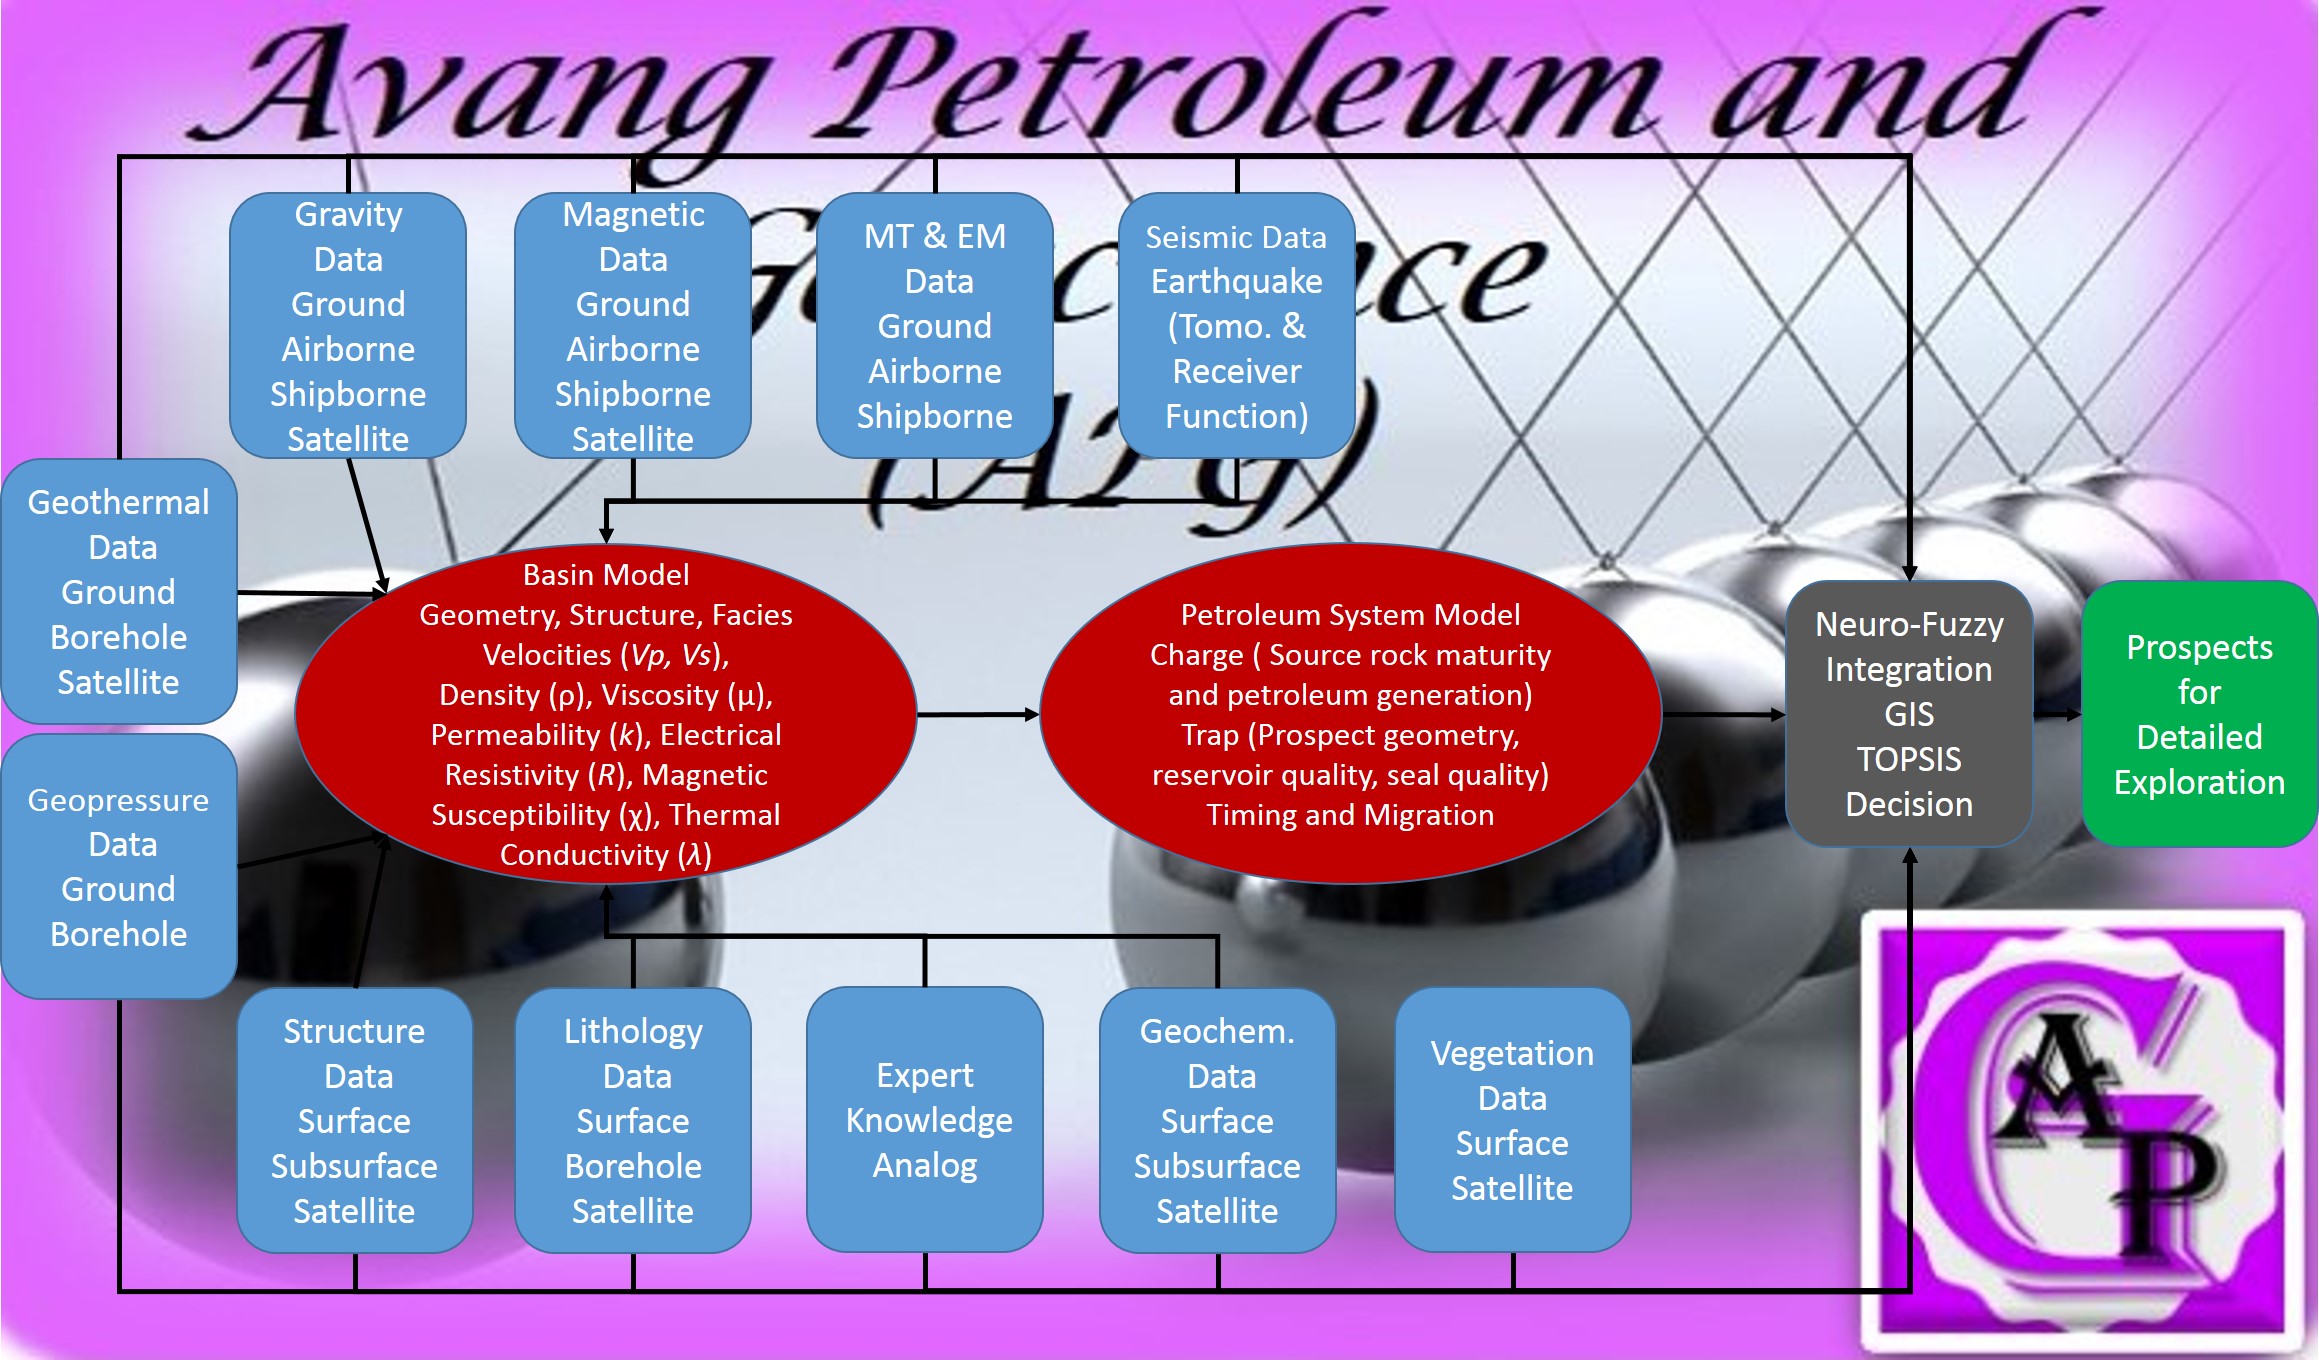
APG’s Integrated Workflow for Petroleum Prospect Generation
Gravity
Gravity data acquisition
Gravity data processing
Gravity data interpretation
Gravity inversion
In gravity surveys we measure gravitational acceleration (g). Gravitational acceleration varies with elevation, latitude, topography, tides, instrument drift, and subsurface density. We make a number of corrections to produce a gravity anomaly that only reflects density variations.
Salt domes, sedimentary basins, mine shafts = gravity low
Metalliferous ore bodies, anticlines = gravity high
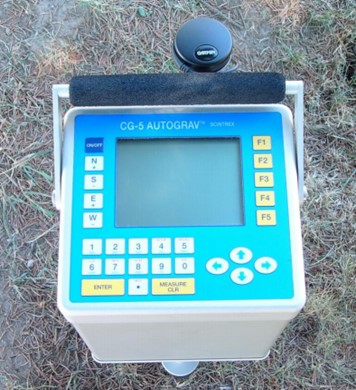 A modern gravimeter
APG removes all the following factors to enhance gravity variations solely due to density contrast of the target:
-
Latitude correction
-
Free air correction
-
Bouguer correction
-
Terrain correction
-
Drift correction
-
Tidal correction
-
Isostasy correction
-
Eötvös correction

Salt dome gravity anomaly

Indian Ocean (Sea Floor Gravity): The sea floor topography
is relatively flat, but gravity imaging highlights the fracture zones as the sediments infilling these fractures are lower in density than the oceanic crust.
Magnetic
-
Magnetic data acquisition
-
Magnetic data processing
-
Magnetic data interpretation
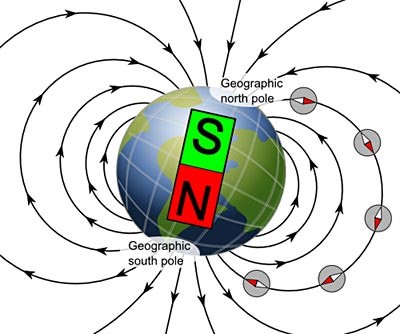
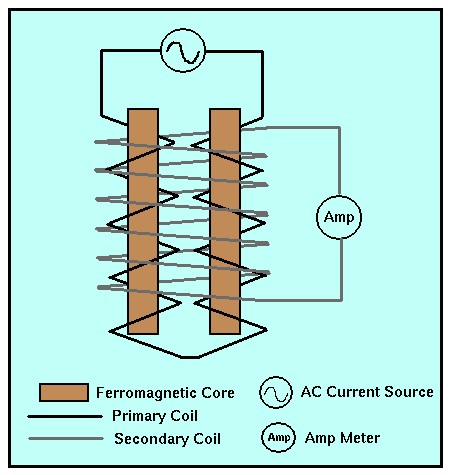
Fluxgate magnetometer
Magnetic observations are routinely collected using any one of three different field operational strategies.
-
Airborne
-
Shipborne
-
Ground Based
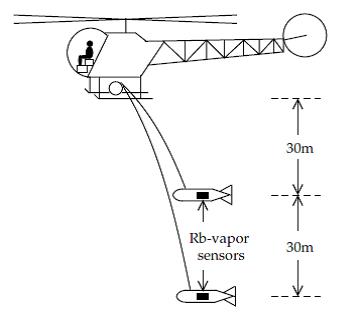
Airborne magnetic operation
Magnetic data processing
-
Reduction of data to a uniform grid by 1D interpolation
-
Pre-processing
-
Continuation (Upward and downward)
-
Derivatives
-
Extraction of vertical component
-
-
Summation of several profiles to attenuate background noise
-
Filtering and setting threshold to locate anomalous areas
-
Analyzing the profiles for the locations and orientations of anomalies
-
Interpolating profiles normal to strike ad centered on anomalies for more detail analysis
-
Comparing profiles with curves developed from models
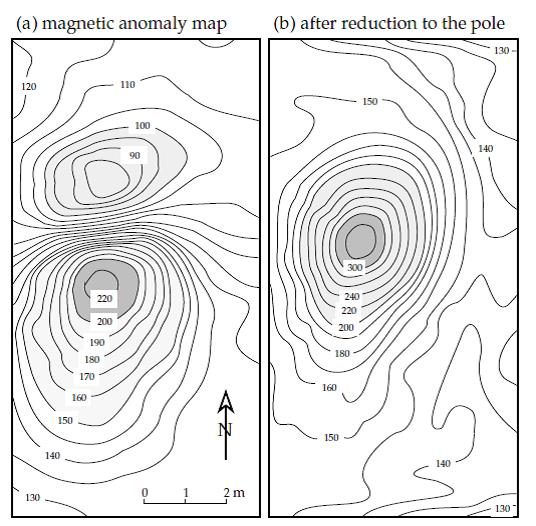
Reduction to pole

magnetic inversion
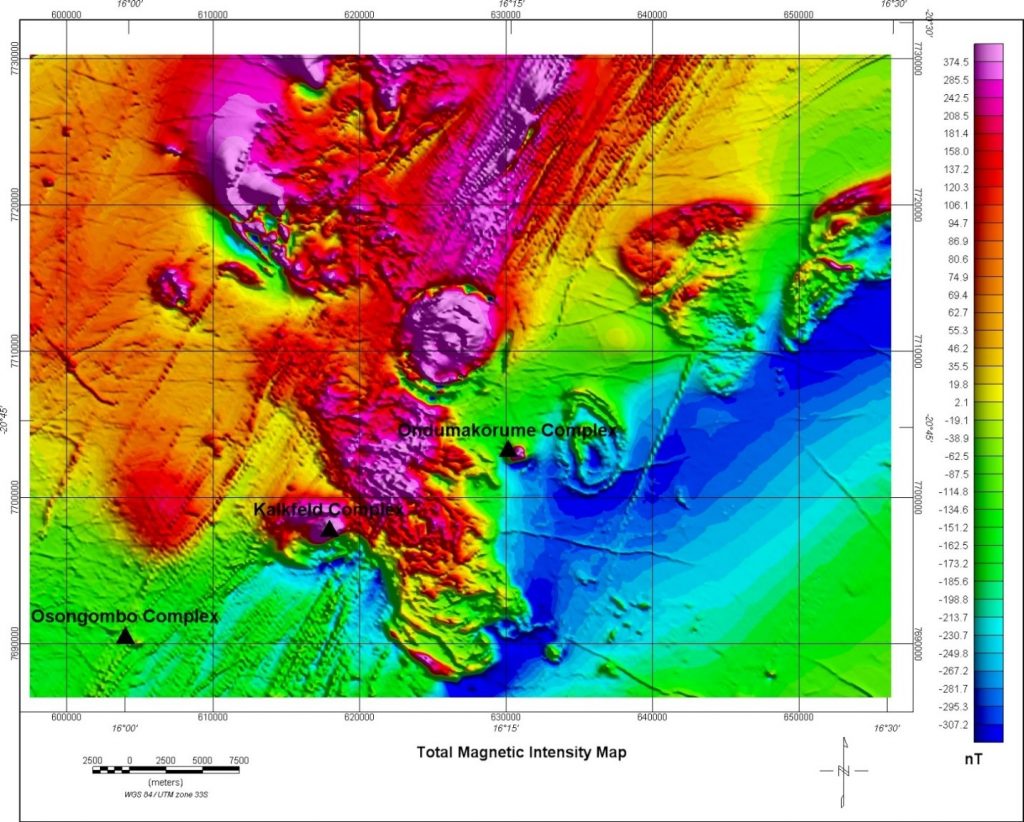
Total magnetic intensity field
Magneto-telluric (MT)
MT is a passive method that employs measurements of naturally occurring electrical currents, or telluric currents, generated by magnetic induction of electrical currents in the ionosphere. Telluric currents flow with circular patterns in earth and change with geographical longitude and season.
Telluric currents have relatively low frequencies (20-20000 Hz), so MT can be used to determine electrical properties of materials at relatively great depths (down to and including the mantle) inside the Earth.
In this technique, a time variation in electrical potential is measured at a base station and at survey stations. Differences in the recorded signal are used to estimate subsurface distribution of electrical resistivity.
MT is of great importance in petroleum exploration and has been used to map salt domes and anticlines.

MT inversion: Salt body with max depth of 5.5 km is imaged.
Electromagnetic (EM)
EM methods come in a wide variety of different configurations:
-
Surface
-
Borehole
-
Surface-to-borehole
-
Cross-borehole
The electromagnetic fields may be of natural origin (magneto- telluric MT) or generated by artificial sources. They are quasi-static (DC resistivity) or time-dependent. The latter are processed either in the time domain (transient electromagnetic TEM) or in the frequency domain (controlled-source electromagnetic CSEM). A virtual experiment serves for identifying the appropriate EM method and a suitable experimental design for resolving the desired target.
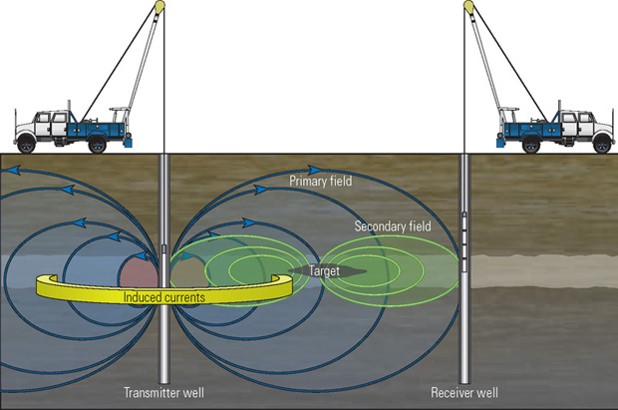
Cross-well EM
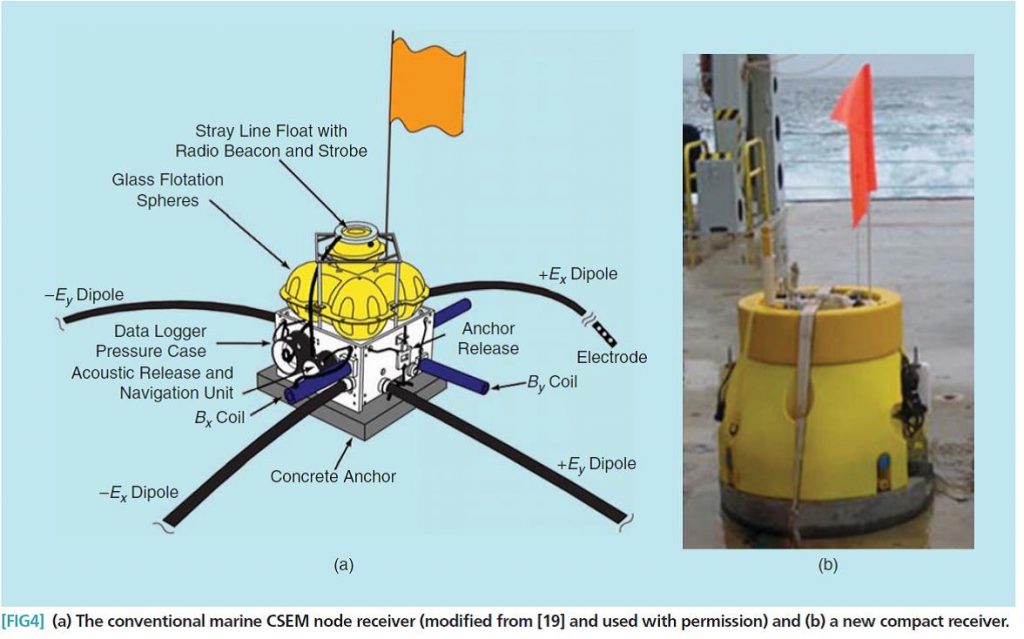
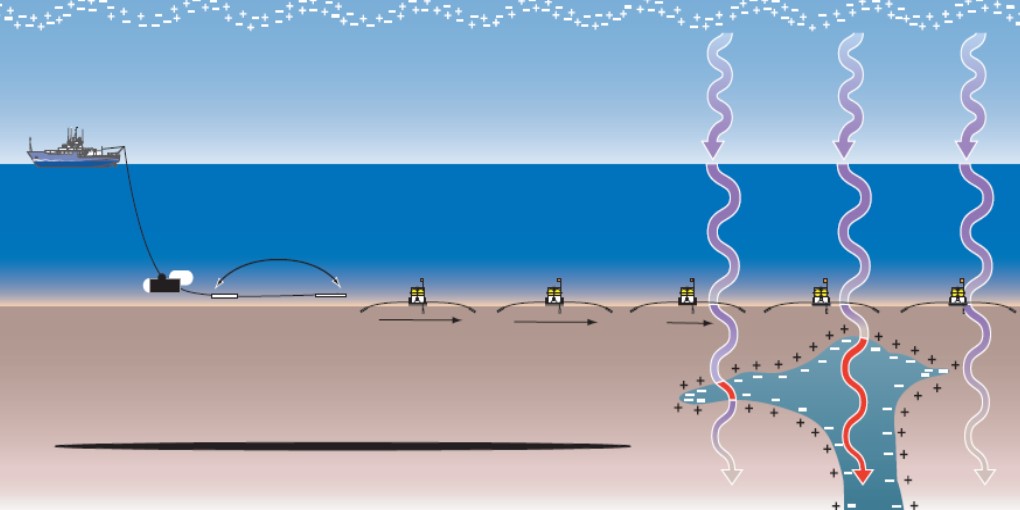
Marine CSEM receivers
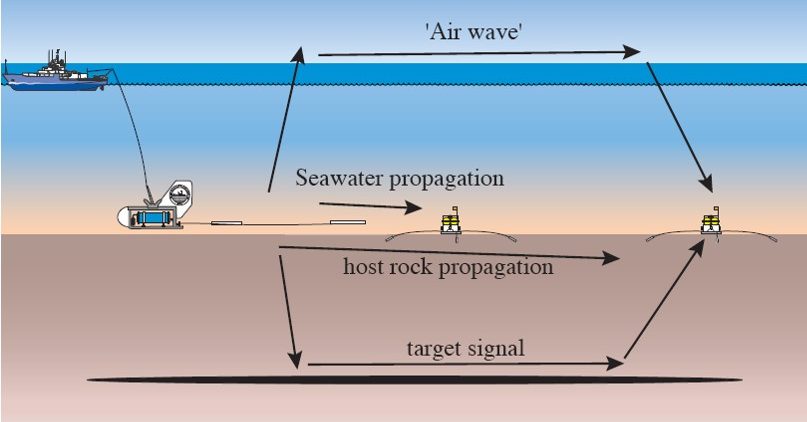
Acquiring CSEM data

CSEM signal
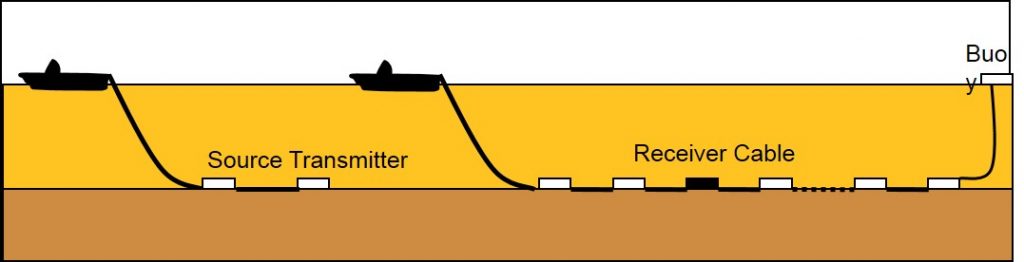
Multi-channel transient EM (MTEM) : the source puts in a measured time-varying current. The receiver measures a time-varying voltage, which is the convolution of the current input with the impulse response of the earth, plus noise. We deconvolve the received voltage for the measured input to get the earth impulse response.
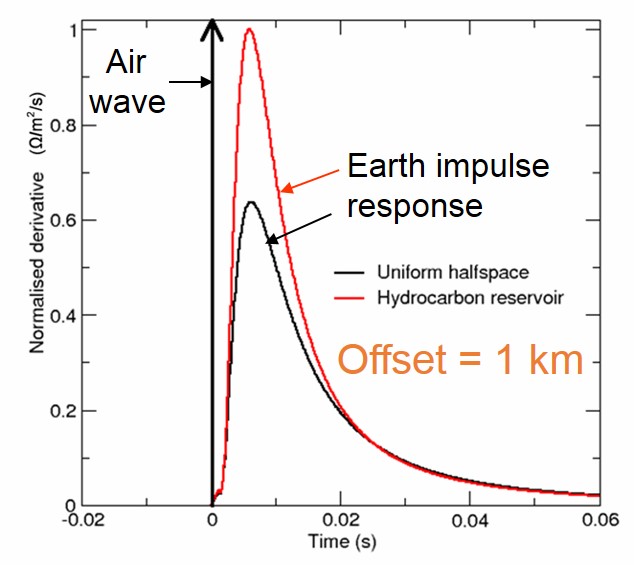
MTEM impulse response of 1D model on land: This function contains all the information about the subsurface resistivity. The response starts with a delta-function at t = 0, whose strength depends on the surface resistivity. This is the ‘air wave’. The air wave precedes the earth impulse response.
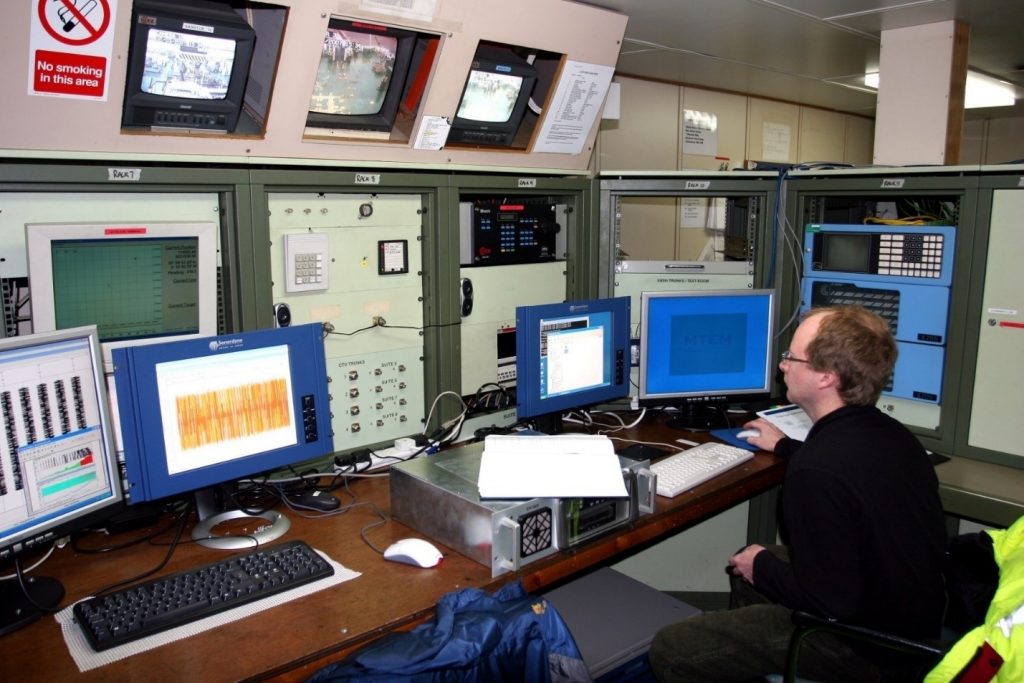
EM real time processing
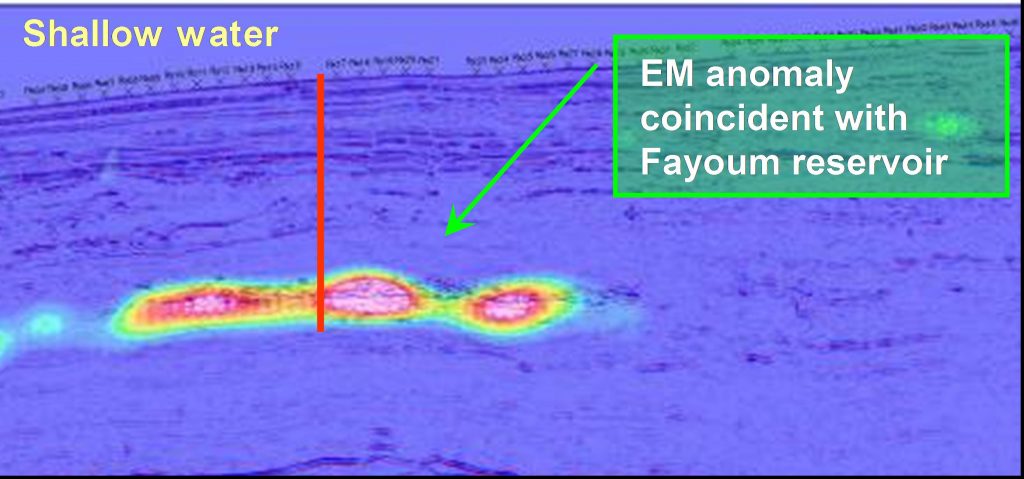
EM defines extent of potential hydrocarbon charge
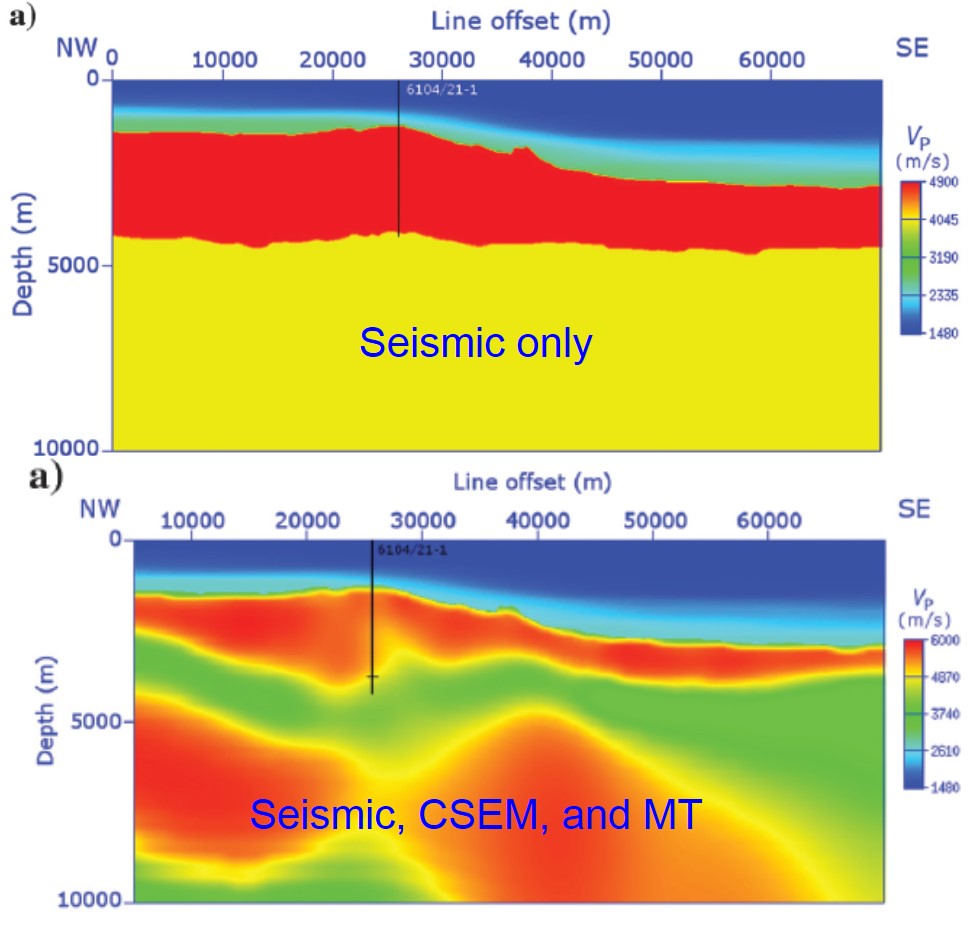 Integrated seismic and EM data imaging
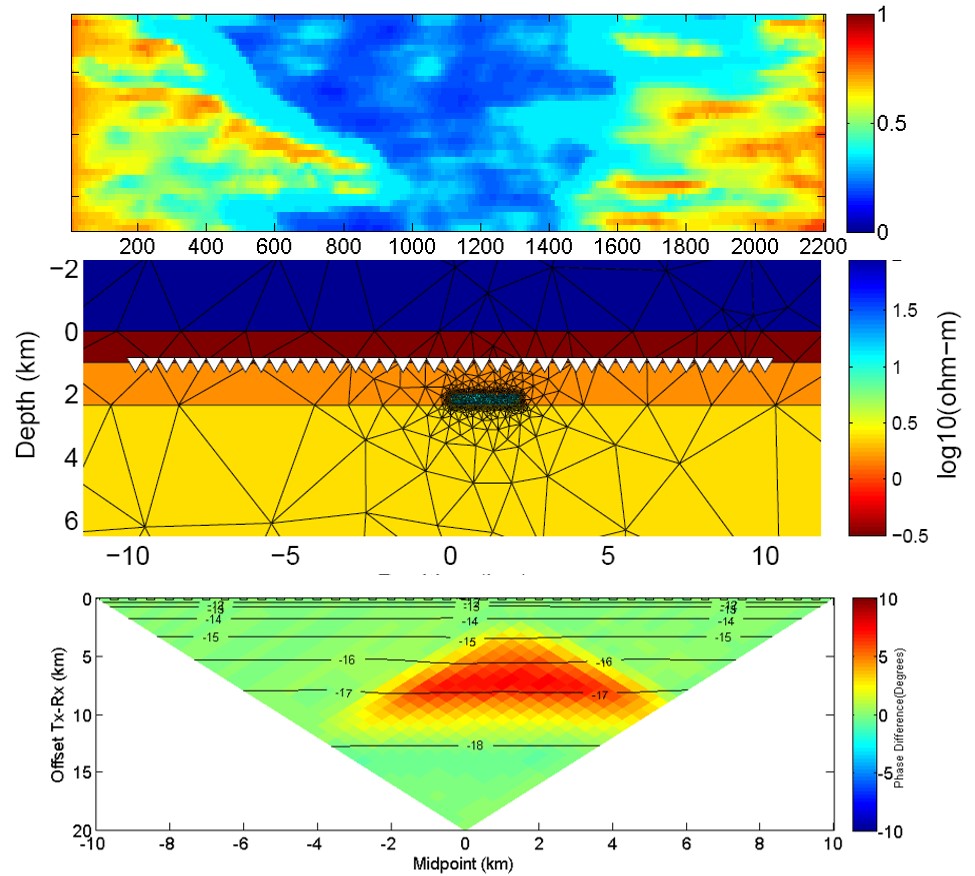
Waterflooding into a black oil reservoir (top), marine CSEM finite element modeling (middle), and 4D CSEM modeling indicating the potential of EM data to monitor water flooding (bottom)
Seismic
We provide the following services to our clients:
-
Supervision/consultancy of seismic projects
-
Target-oriented seismic survey design and modeling
-
Seismic data acquisition
-
Offshore & land
-
Dynamite & vibrator
-
-
Seismic data processing
-
PSTM, PSDM, and FWI
-
Isotropic & Anisotropic
-
Post-Migration Re-processing (PMR)
-
Time-lapse data matching
-
Conventional and multi-component (3C)
-
VSP processing (zero-offset, offset, walkaway)
-
-
Seismic data interpretation
-
Quantitative interpretation (QI)
-
Petrophyscial evaluation using well logs and core data
-
Seismic petrophysics and rock physics modeling
-
Amplitude vs. Offset (AVO)
-
Seismic inversion (post & pre-stack; deterministic and stochastic )
-
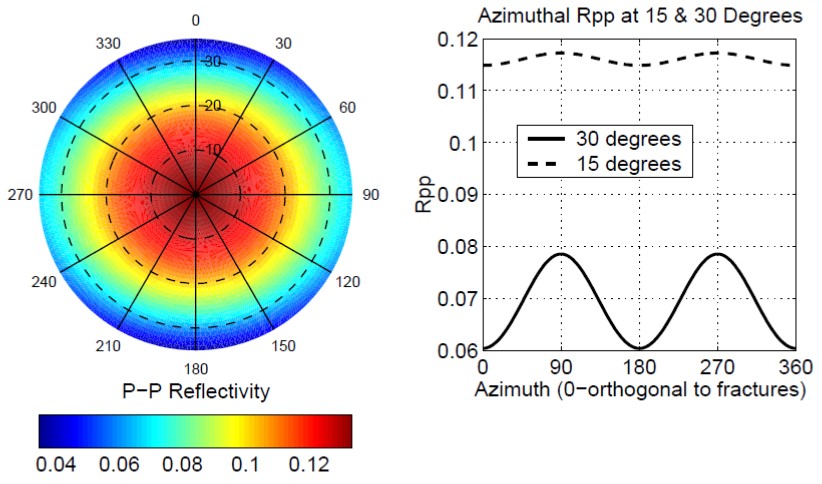
Anisotropy analysis and AVOZ for fracture detection
-
Facies classification (lithology, porosity, fluid)
-
4D (time-lapse) feasibility study, modeling, inversion
-
Seismic reservoir history matching
-
Multi-component feasibility study, modeling, and inversion
-
Seismic geomechanics
-
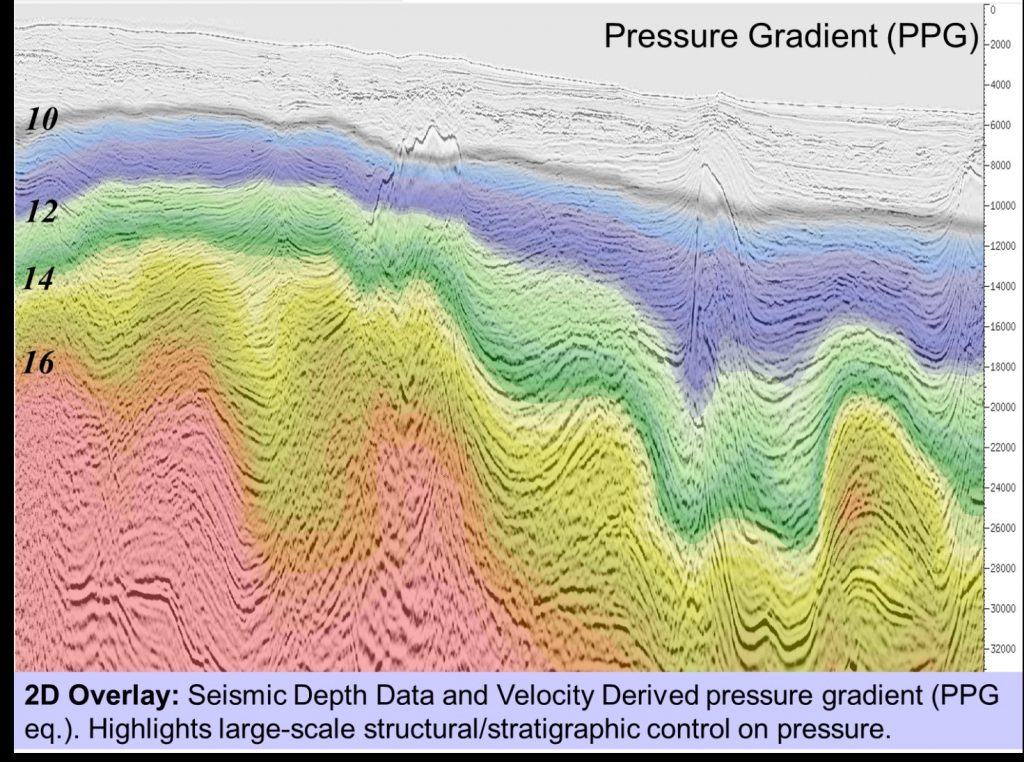
Pore pressure and fracture gradient (PPFG)
-
Reservoir depletion
-
Wellbore stability
-
Well placement
-
-
Unconventional resource play
-
Application of machine learning in seismic analysis
-
Seismic stratigraphy to detect lateral variations of stratigraphic traps
-
Optimum fault detection using modern algorithms
-
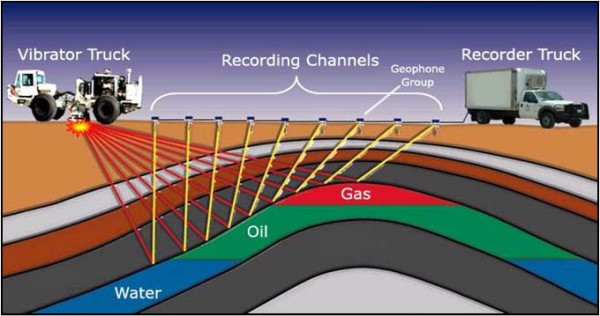
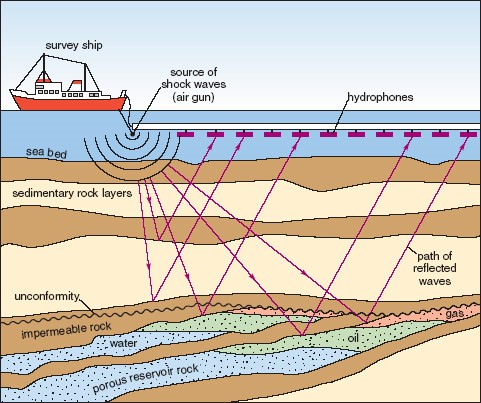
Acquiring seismic data on land and offshore
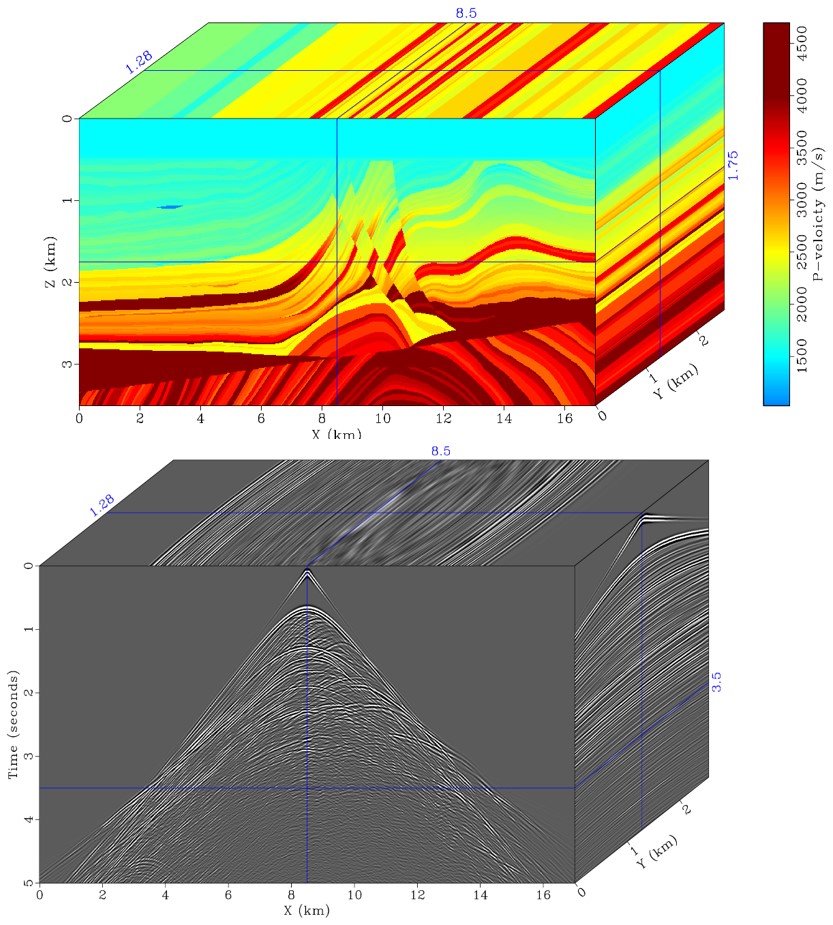
Full elastic seismic modeling in complex geology
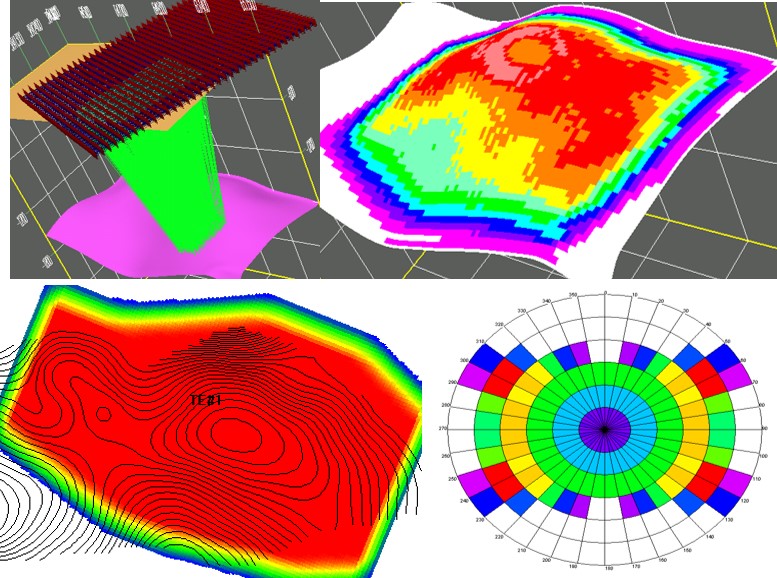
Seismic survey design and modeling (ray tracing)
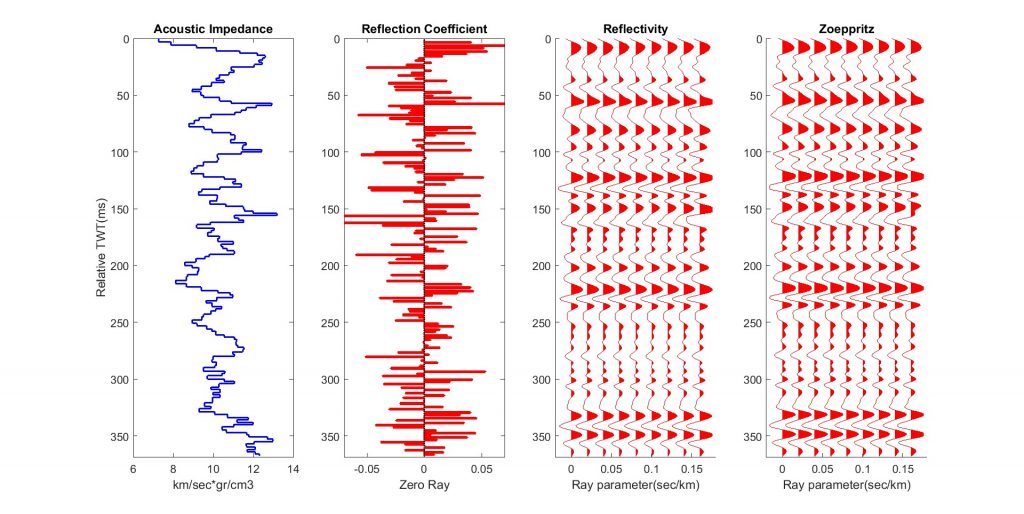
Priority in-house 1D seismic modeling

Seismic data processing
4D seismic data conditioning (alignment, filtering, frequency boosting, noise attenuation)
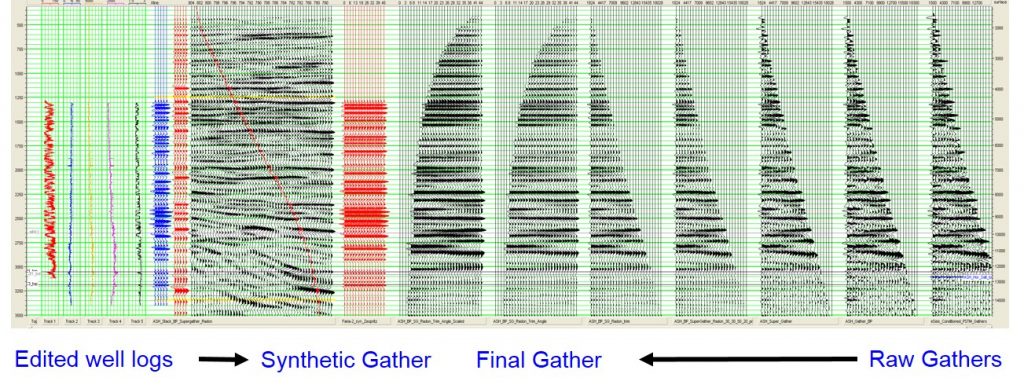
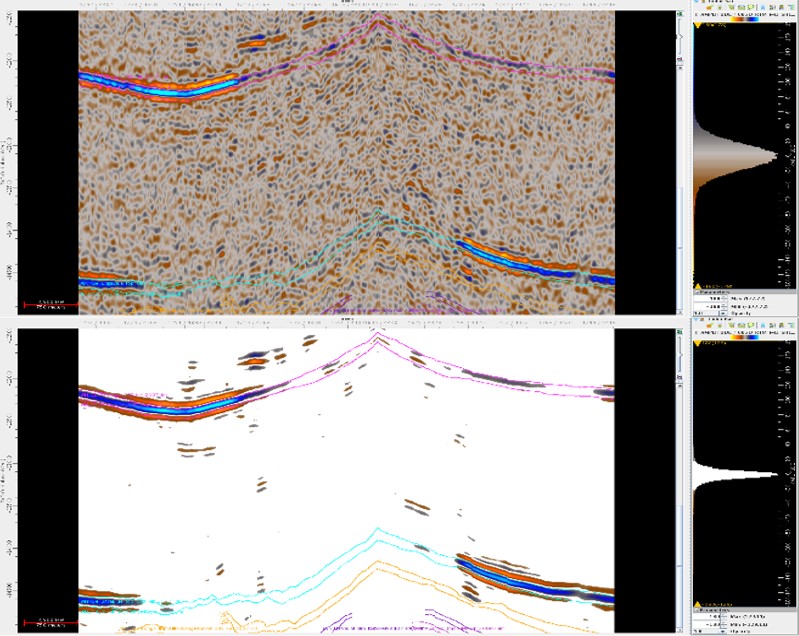
Seismic gather conditioning for quantitative interpretation (QI)
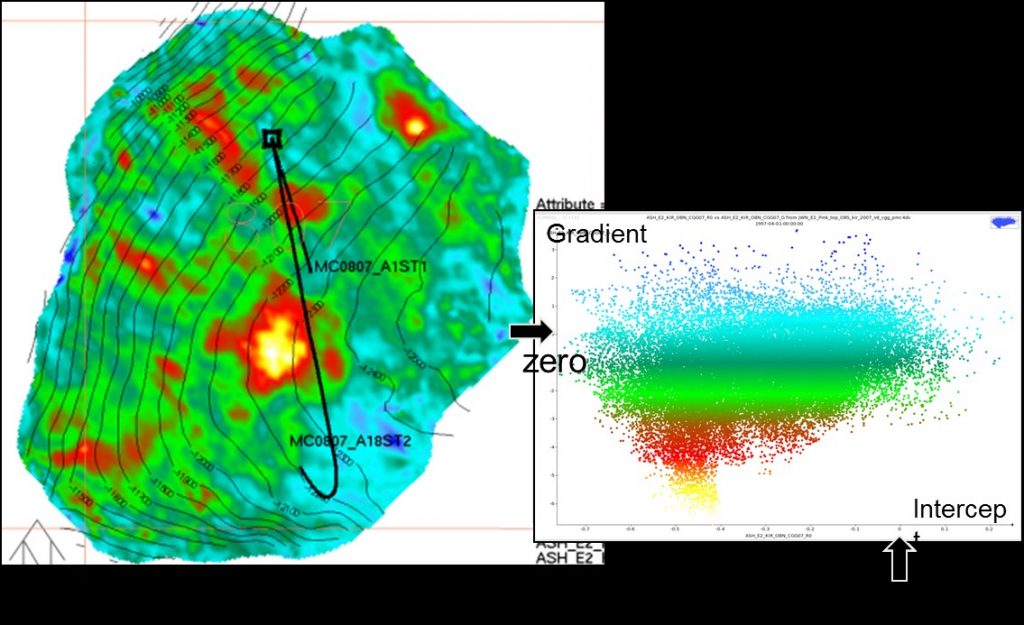
Seismic AVO analysis for facies classification
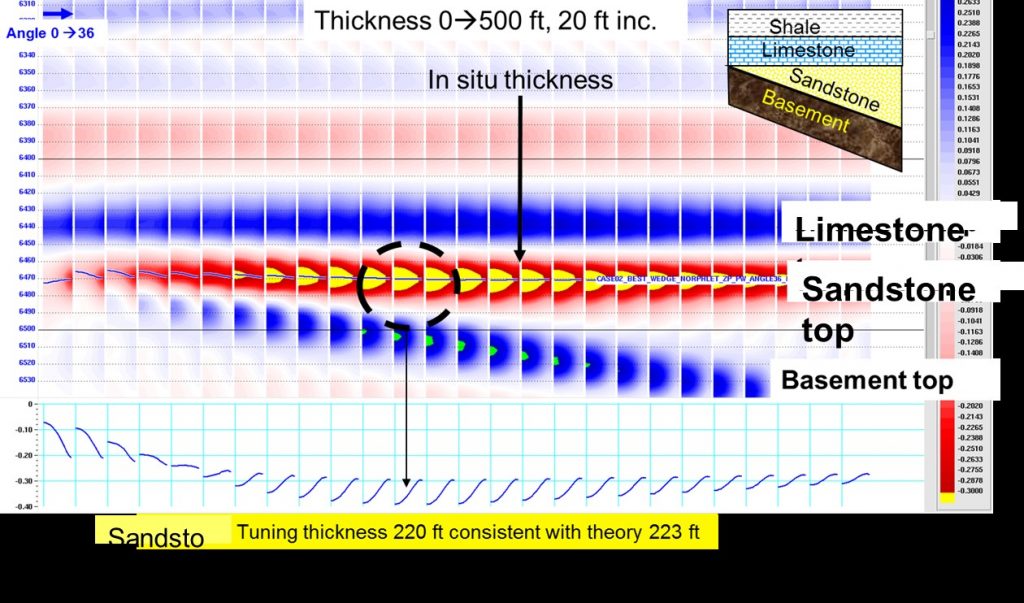
Wedge modeling
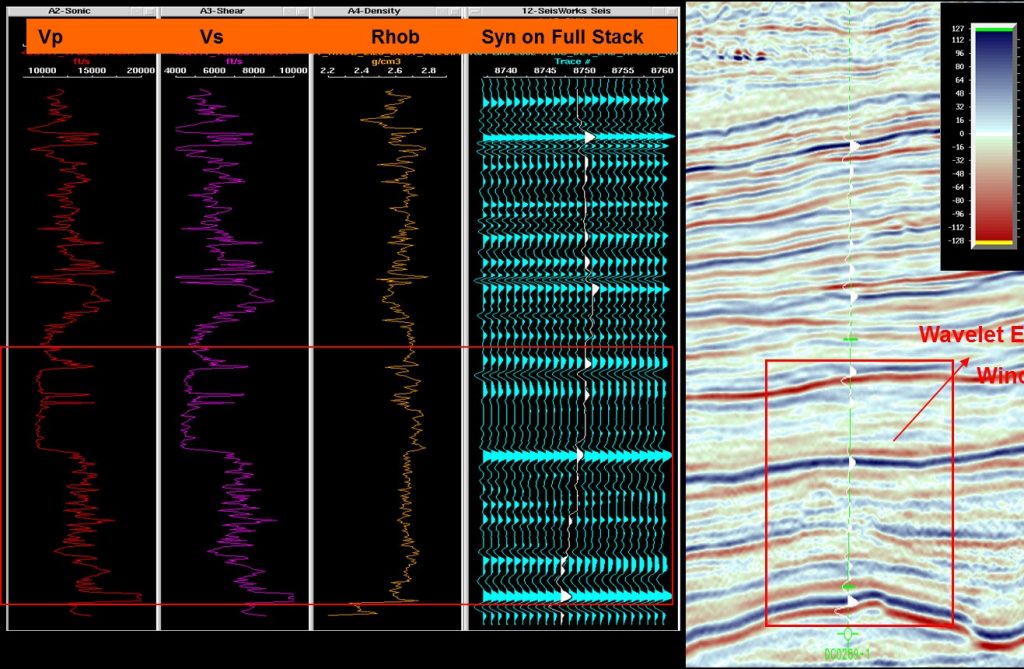
Seismic well tie and wavelet extraction
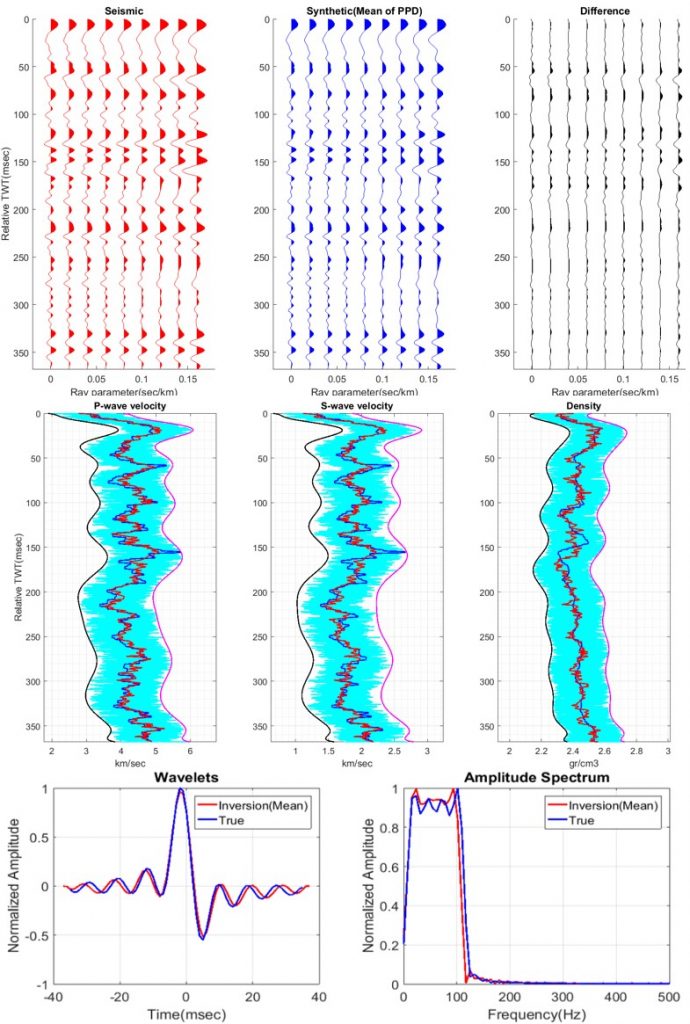
Stochastic coupled seismic and wavelet inversion
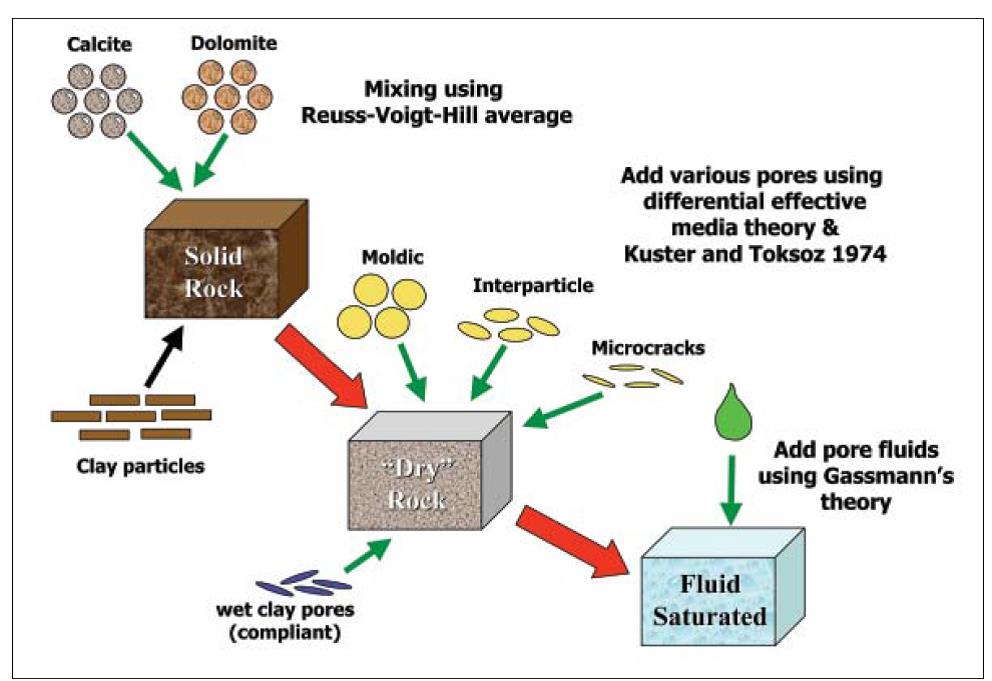
Differential Effective Medium (DEM) theory: Rock physics modeling

Rock physics modeling using ultrasonic core for a dual-porosity carbonate

Rock physics and associated seismic modeling
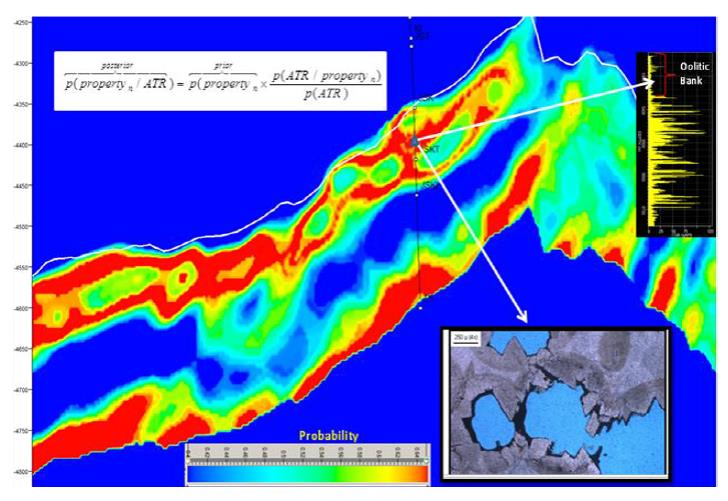
PDF of seismic-derived vuggy porosity verified by well logs and thin section